
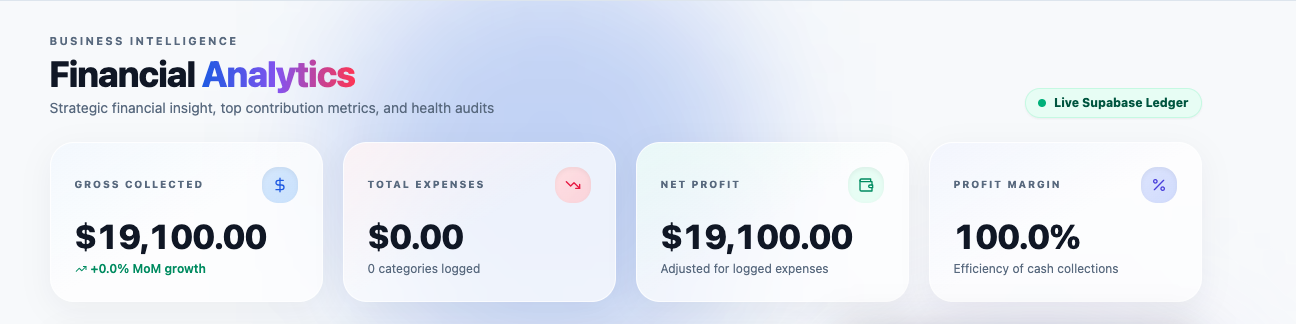
1. Gross Collected Revenue
Not what you invoiced. What actually landed in your account. The gap between those two numbers is money you've earned but can't spend yet — and if it's growing, you're effectively financing your clients' cash flow. ClientDeck computes this from all your paid invoices automatically.
2. Outstanding Accounts Receivable
Total invoiced minus total collected. If this number trends up month after month, clients are paying slower than you're billing. That's a problem that compounds. Pair this metric with automatic payment reminders and you can usually reverse the trend without an awkward conversation.
3. Net Profit
Revenue minus expenses. Simple, but easy to ignore when things are busy. A freelancer billing $10K a month but spending $8K on ads, tools, and subcontractors is in a very different position than someone billing $7K with $1K in costs. ClientDeck calculates this from your paid invoices and logged expenses — nothing extra to track.
4. Profit Margin
Net profit divided by gross revenue, as a percentage. Most solo freelancers I've talked to run somewhere between 50% and 70%. Below 40% usually means one of two things: your rates are too low, or your costs are too high. The expense breakdown in ClientDeck makes it easy to figure out which.
5. Month-over-Month Growth
A single month's number is just a data point. The trend tells you where you're heading. ClientDeck compares your trailing 30 days of collected revenue against the 30 days before that and gives you a percentage. Flat or negative? Time to pitch, raise rates, or replace a low-paying client with a better one.
6. Client Concentration
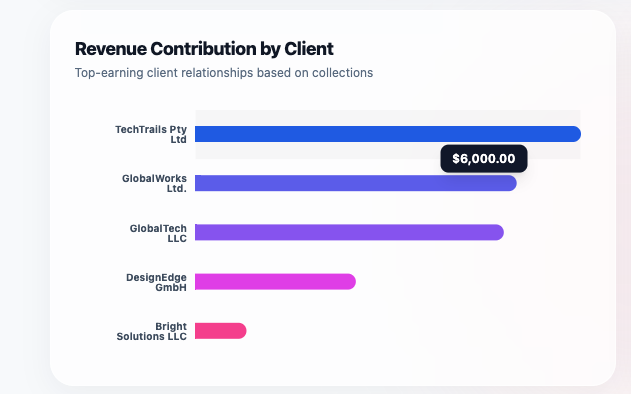
Your top 5 clients ranked by revenue, visualized as a bar chart. If one bar is way taller than the others, you've got concentration risk. Losing that client would be more than an inconvenience — it could be business-ending. This view alone has convinced freelancers to start diversifying before a crisis forced them to.
Going a level deeper
The six metrics above are the essentials. The Analytics tab also includes three views that help you plan rather than just measure:
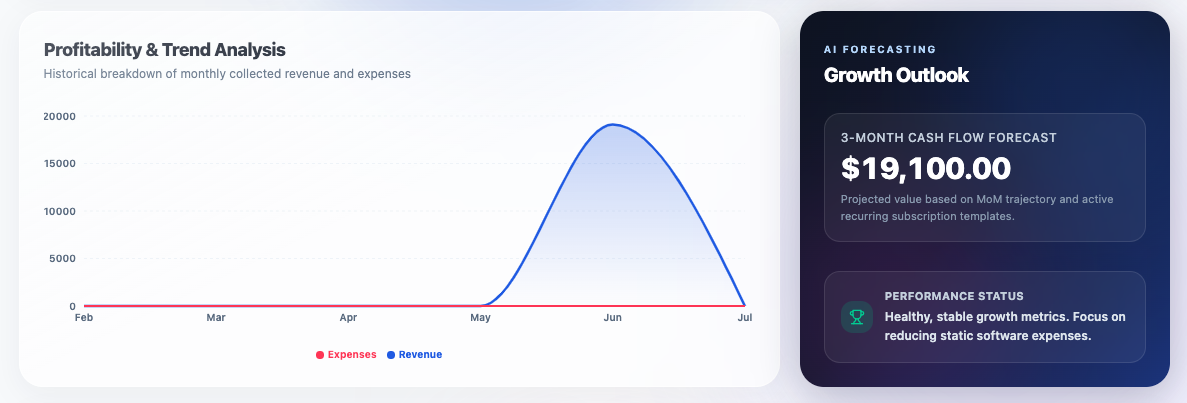
- 6-month revenue vs. expenses chart — an area chart that makes seasonal patterns obvious. If your revenue always dips in December, you'll see it coming and plan for it.
- Expense category breakdown — software, advertising, subcontractors, travel, supplies. Percentages included. Good for spotting a tool subscription that's quietly doubled in price.
- 3-month cash flow forecast — takes your trailing 90-day average, adds in active recurring invoice templates, and projects forward. Conservative by design — it doesn't assume growth you haven't already shown.
How this connects to AI reports
These six metrics describe your business. The AI Report Builder does the same job for your clients' results — turns their campaign stats, project updates, and content metrics into reports that prove your value. You track your own numbers in Analytics; your clients see theirs in the portal. The loop closes.
Plan requirements
The Analytics tab is Pro-only ($24/mo). Free and Plus show a preview with sample data so you can see what you'd get. Pro also bumps AI reports to 150/month and unlocks unlimited portals, white-labeling, and custom domains.
Frequently asked questions
You log expenses as they happen — amount, category, date. It takes seconds. The dashboard pulls from those records automatically. If you're on QuickBooks or Xero, ClientDeck integrates with both on the Pro plan, so you can sync expense data instead of entering it twice.
50–70% is the range most solo freelancers land in. Below 40% is worth investigating — either your rates need a bump or something on the expense side is eating more than it should. The expense breakdown chart will usually point you to the culprit pretty quickly.
Two numbers added together: your average monthly revenue over the last 90 days, plus the monthly value of your active recurring invoice templates. Multiply by 3 for a 3-month projection. It's intentionally conservative — no hockey-stick assumptions.
See your real numbers — not mock data.
Upgrade to Pro