
What's wrong with the old way
I've talked to a lot of agency owners about this. The reporting process is almost always the same: export data from platforms, paste into a template, add commentary at the end. Nobody enjoys it. The client doesn't enjoy reading it either, because raw metrics without interpretation don't answer the question they actually care about: "is this working?"
When you think about it, a useful client report only needs to do three things. Show what happened. Explain whether it was good or bad. Say what you're doing next. That's it. AI happens to be really good at all three — it spots patterns, quantifies them, and writes about them clearly.
What the AI actually produces
The output isn't a generic "here are your stats" template. It's a structured document with a point of view. Headline metrics at the top so the client sees the important stuff immediately. Then a performance breakdown — what worked, what underperformed, what changed from last month. Then a recommendations section that connects the analysis to next steps.
You get to it through one of three paths, same as the freelancer workflow:
- Instant — paste campaign stats, meeting notes, whatever. The AI builds the report around it.
- Guided — pick Performance, Project Update, or Content Report; fill in the fields you have; let the AI handle the rest.
- Upload — drop a CSV or spreadsheet. Add instructions if you want.
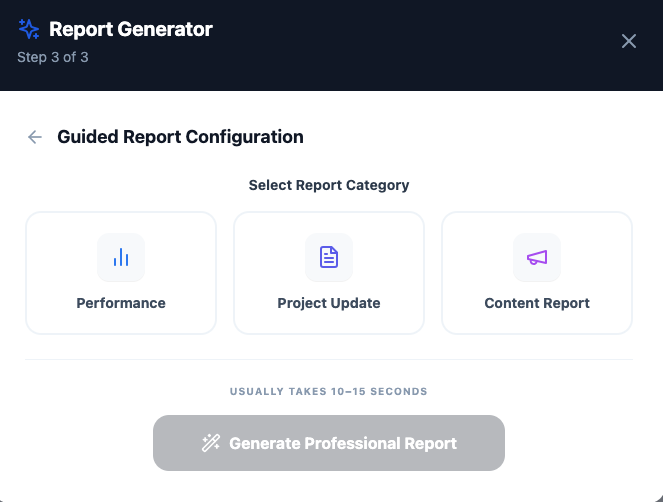
You can (and should) edit before sending
The draft is a starting point. You've got full text editing — rewrite the recommendations, add client-specific context, remove sections that don't apply. If you want the AI to take another pass with a different angle, hit Regenerate and tell it what direction to go. Things like "make the tone more executive," "add a section comparing this to last quarter," or "shorten it to one page" all work.
The portal is where retention happens
Sending a report as a PDF is fine — for about 48 hours. Then it's buried in an inbox and the client can't find it when they need it. The portal approach is different. Every report you publish lives in the client's branded workspace, alongside their invoices, project boards, proposals, and shared files. Your logo, your colors. (Pro plan lets you map it to your own domain, too.)
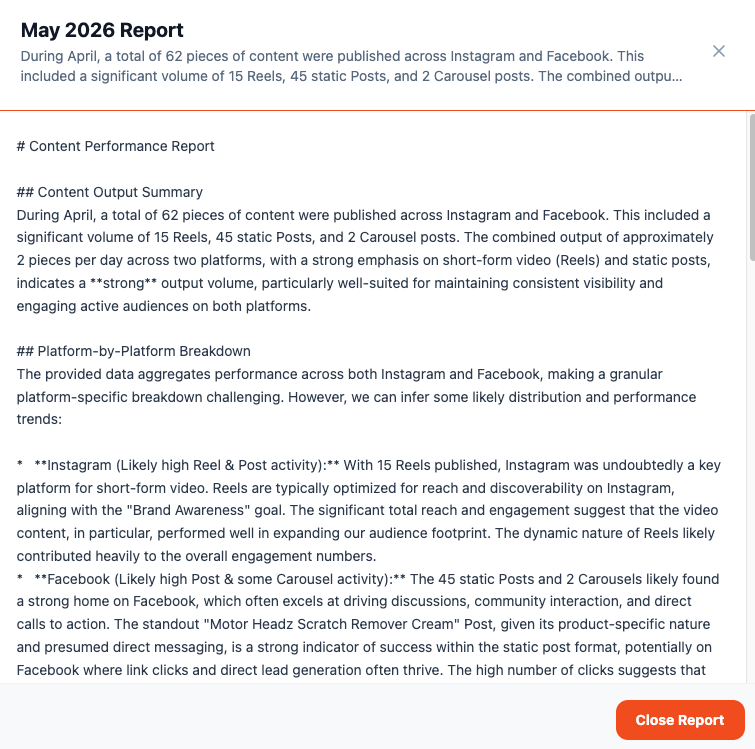
Retention comes from clients seeing the value you deliver, consistently. A portal with a growing archive of professional reports makes that value visible every time they log in.
Automate the recurring ones
Retainer clients typically get the same type of report every month. Set up Autopilot once — pick the frequency, delivery time, and any standing instructions — and let it run. Each client gets their own schedule. There's a test button so you can verify the output before the first real delivery.
A quick word on the Analytics tab
While you're generating reports for clients, the Analytics tab (Pro plan) is tracking your agency's own numbers: gross collected revenue, net profit, outstanding AR, 6-month trends, top clients by revenue, expense breakdowns, and a 3-month cash flow forecast. It's the same kind of clarity you're giving your clients, applied inward. Worth a look even if you're not a "numbers person."
Frequently asked questions
About 10–15 seconds from clicking Generate to seeing the draft. You'll see a progress indicator cycle through a few phases — reading your inputs, calculating metrics, drafting, polishing — but honestly it's fast enough that you won't have time to switch tabs.
The report lives inside your client's portal, which is branded with your logo, brand color, cover banner, and welcome message. On Pro, you can put the whole portal on your own domain. So the client experience is 100% your brand, start to finish.
Edit it. The whole document is a text field. Or use Regenerate and tell it what to do differently. I've used prompts like "this is for a CFO, make it more formal" and "cut the fluff, keep it to key numbers" — both worked. It replaces the old draft with the new one, so there's no risk of losing work.
No. The AI processes whatever you put into the report wizard to generate that specific report. It doesn't train on your data, and reports are stored in your workspace with the same per-client access controls as everything else in ClientDeck.
Send a report your client will actually read this month.
Try ClientDeck free